Liquid Staking APY Comparison
Live DeFi yields from Orokai Reports, updated daily
On Ethereum, Frax (sfrxETH) pays the most at 2.83% APY, while Lido (stETH), the largest by TVL, pays 2.26%.
Solana liquid staking pays a median 4.99% APY, compared with 2.25% on Ethereum — 2.73 percentage points more.
The highest stablecoin savings rate tracked is Ethena (sUSDe) at 5.02% APY.
Data as of November 14, 2026.
Current APY by asset
Ethereum liquid staking and restaking
Stake ETH and keep a liquid token that earns staking rewards.
| Protocol | Type | APY (7d) | 30-day avg | TVL |
|---|---|---|---|---|
| Frax · sfrxETH | Liquid staking | 2.83% | 2.64% | $64.9M |
| ether.fi · eETH | Restaking | 2.73% | 2.55% | $3.9B |
| Kelp · rsETH | Restaking | 2.58% | 2.71% | $640.9M |
| Coinbase · cbETH | Liquid staking | 2.41% | 2.64% | $351M |
| Lido · stETH | Liquid staking | 2.26% | 2.76% | $17.1B |
| StakeWise · osETH | Liquid staking | 2.25% | 2.26% | $279.2M |
| Binance · wBETH | Liquid staking | 2.24% | 2.44% | $6.4B |
| Stader · ETHx | Liquid staking | 2.22% | 2.59% | $103.9M |
| Mantle · mETH | Liquid staking | 2.05% | 2.30% | $418.6M |
| Rocket Pool · rETH | Liquid staking | 1.80% | 1.98% | $845.5M |
Solana liquid staking
Stake SOL through a liquid staking token instead of a single validator.
| Protocol | Type | APY (7d) | 30-day avg | TVL |
|---|---|---|---|---|
| Phantom · PSOL | Liquid staking | 5.48% | 5.45% | $112.5M |
| Marinade · mSOL | Liquid staking | 5.46% | 5.07% | $156.2M |
| Helius · hSOL | Liquid staking | 5.13% | 5.05% | $74.9M |
| Jupiter · JupSOL | Liquid staking | 5.03% | 5.11% | $358.3M |
| Drift · dSOL | Liquid staking | 4.94% | 4.91% | $209.5M |
| Jito · JitoSOL | Liquid staking | 4.75% | 4.80% | $703.5M |
| Bybit · bbSOL | Liquid staking | 4.64% | 4.68% | $92.7M |
| Binance · BNSOL | Liquid staking | 4.52% | 4.54% | $721.7M |
Stablecoin savings
Earn in dollars without token price risk — the yield comes from lending or trading strategies.
| Protocol | Type | APY (7d) | 30-day avg | TVL |
|---|---|---|---|---|
| Ethena · sUSDe | Savings | 5.02% | 5.04% | $1.2B |
| Sky · sUSDS | Savings | 3.80% | 3.80% | $3.7B |
Other networks
Liquid staking on Hyperliquid and Avalanche.
| Protocol | Type | APY (7d) | 30-day avg | TVL |
|---|---|---|---|---|
| Benqi · sAVAX | Liquid staking | 3.40% | 4.34% | $168.9M |
| Kinetiq · kHYPE | Liquid staking | 1.92% | 1.94% | $610.2M |
How to read the numbers. APY (7d) is the median of the last seven daily readings, so a one-day spike does not distort it; the 30-day average shows the longer trend. TVL is the latest total value locked. Readings above 40% APY, pools under $20M TVL and data older than 14 days are left out. Yields change daily and are not guaranteed.
Monthly Orokai Reports
Beyond the daily numbers, each monthly report combines macro insights with protocol-level data to explain where DeFi yields are moving and why.
Market Overview
Every report starts with a monthly overview of the DeFi market and passive income conditions.
We analyze:
- overall crypto market environment
- total value locked (TVL) trends
- investor sentiment toward DeFi yields
- shifts between high-risk and conservative strategies
- the growing role of tokenized real-world assets (RWA)
This section explains how macro market conditions influence yield opportunities across decentralized finance.
- Lending24.9%
- Liquid Staking21.0%
- Bridge17.6%
- Others12.3%
- Restaking7.0%
- RWA6.9%
- DEXs6.1%
- Liquid Restaking4.1%
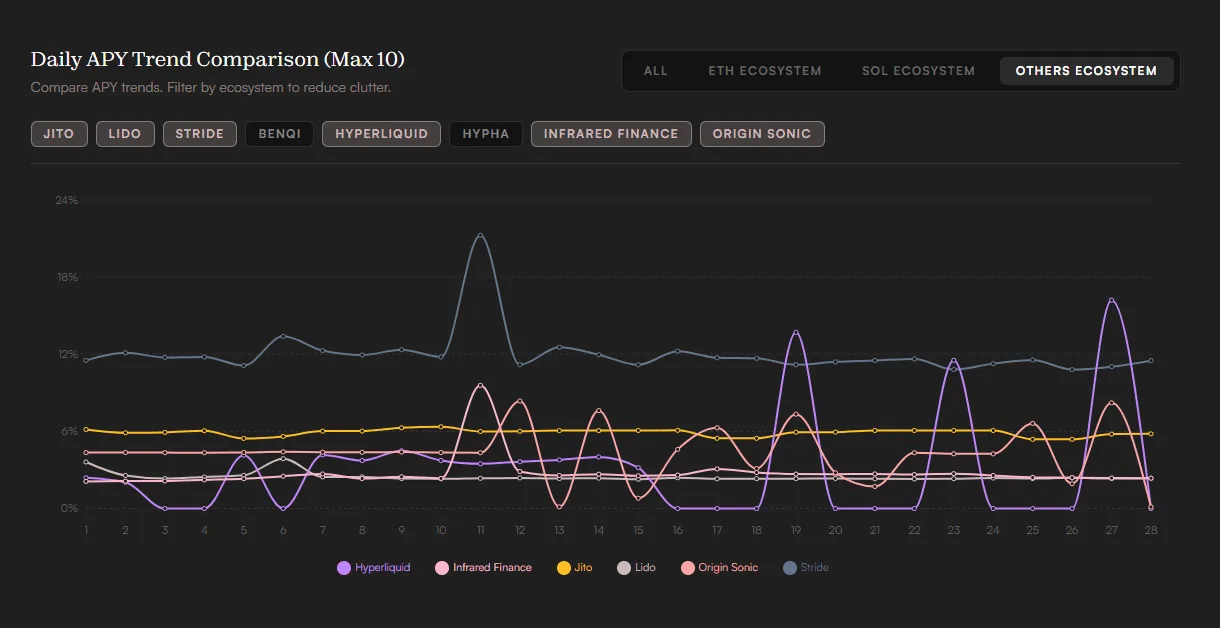
Daily Trend Comparison
The reports include a visual comparison of DeFi protocols across multiple ecosystems.
Protocols are grouped by ecosystem.
Users can overlay up to ten protocols on a single chart to compare how their TVL and performance evolved during the month.
This makes it possible to quickly identify:
- rising protocols
- declining liquidity
- ecosystem-level trends
Protocol Performance and Yield Tracking
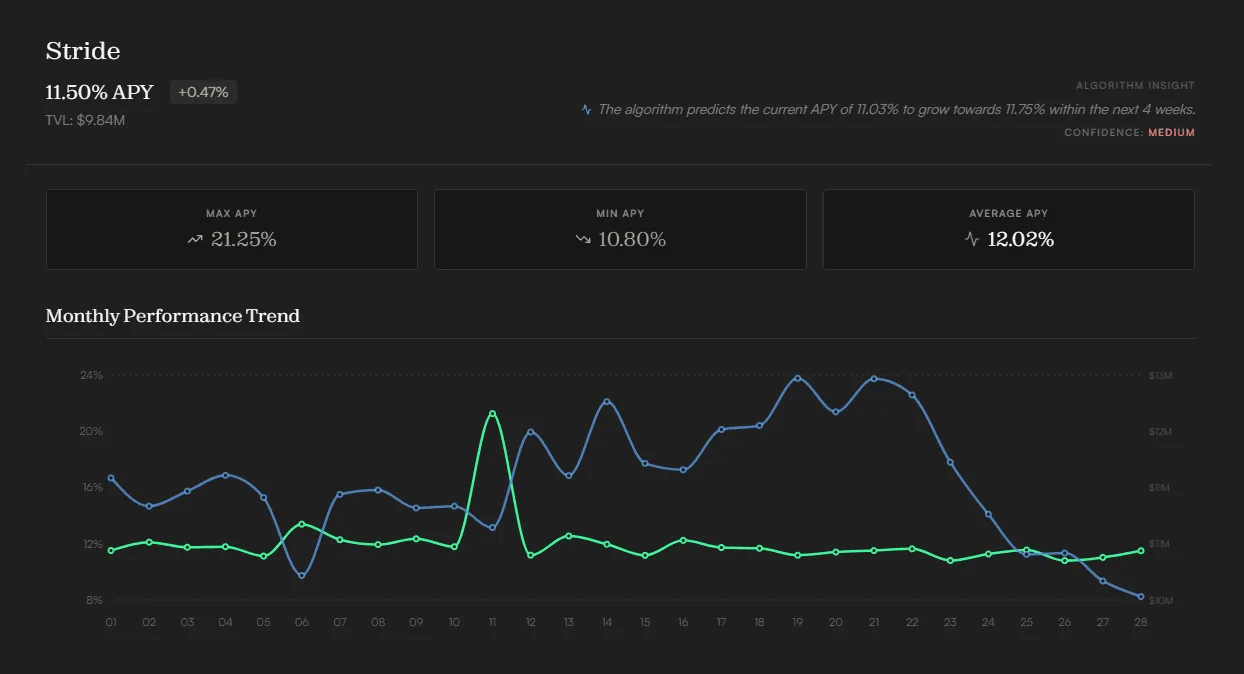
Each report also includes a table of major passive-income protocols showing:
- 30-day TVL trend
- current APY
- yield changes compared to the previous month
Clicking on a protocol expands detailed charts and additional analysis.
Algorithm Insight
For each protocol, the Orokai system generates a forward-looking yield outlook.
The algorithm analyzes historical data and current trends to estimate how APY levels could evolve in the coming weeks.
These insights provide a directional view of the yield environment rather than deterministic forecasts.
News and Market Events
Each report also summarizes the most important developments affecting DeFi yields.
Events are grouped into six categories:
- Big Picture Events
- Important Changes on Blockchains
- Token Unlocks
- DeFi and Stablecoin Yields
- Growth of Real-World Assets (RWA)
- Risk and Volatility
Transparent Methodology
All insights are based on publicly available blockchain data and a transparent analytical framework.
The methodology section explains:
- how protocol data is collected
- how yield metrics are calculated
- how the algorithm generates forward-looking scenarios
This ensures that the reports remain data-driven and reproducible.
Why Orokai Reports exist
DeFi offers many opportunities for passive income, but the ecosystem changes quickly.
New protocols appear, liquidity moves across chains, and yields shift as market conditions evolve.
Orokai Reports aim to provide a structured monthly snapshot of this environment, helping users navigate decentralized finance with greater clarity.
Put the Data to Work

Investing that fits your life
With Orokai, financial growth doesn’t mean pressure or complexity — it means freedom.